

Just the other day Gerrit Grunwald (@hansolo_) tweeted he made a DateAxis which supports JSR310 (date/time) api, and which is based on my work and also on Christian Schudt and Diego Cirujano-Cuesta work (they created a DateAxis which accepts DateTime). He later added that he would eventually create a blog post about it if he had time (you should stay tuned his posts are usually high quality). This reminded me that a blog post about my DateAxis and XYBarChart is long overdue since I’ve made a lot of changes since my last posts on the subject. Besides the changes I also wanted to explain my implementation of the DateAxis and why I’m sticking with the design (code design not artistic design) choices I’ve made.
Design decisions while creating DateAxis
While creating DateAxis I had two choices, either extend from Axis or from ValueAxis. Extending from Axis would allow me to accept DateTime or the new date formats from JSR310, while extending from ValueAxis would guarantee the presence of methods like setLowerBound and setUpperBound which would allow a user to filter or zoom in on specific dates, a fairly common use case, but would mean programmers would first need to convert the date to a number before adding it to the chart. Of course you can add filtering methods yourself while extending from Axis but a component that does zooming on charts and is expecting a ValueAxis (which guarantees setUpperBound and setLowerBound) wouldn’t work with that implementation.
Even though at first I was thinking that extending from Axis would be better, I’m now more convinced that the current solution – extending from ValueAxis, is a better one, for the reasons expressed earlier, and the draw back of having to convert the date to a number isn’t such a big thing.
I think it would be best if the JavaFX charts API would allow one to separate the position of a value in an axis from the value itself I think it would be best for setLowerBound and setUpperBound to be mandatory methods on Axis, but has things are right now you have to take in consideration the two drawbacks mentioned earlier before starting to implement a new axis.
Changes made to DateAxis and XYBarChart
I’m afraid I’ve probably forgotten about most of the changes I’ve made, anyway here’s what I recall:
DateAxis
- After changing range (by zooming in for instance) the tick marks interval stayed the same. Now they are recalculated.
- Added a bigger set of tick ranges to accommodate a higher range of dates.
XYBarChart (this previous post explains what this is)
- On some occasions depending on the data you add to the chart, it may not render any bars even though there is data to be displayed. This is a bug that exists in javafx BarChart and was passed on to this chart since there was some copying of code.
Today, I also added one more enhancement to the DateAxis which was on the pipeline of changes I wanted to make. Basically the format of the dates will change depending on the range of values that is being shown: for instance, if each tick mark represents more than a month than only the month and year of that tick mark is shown otherwise the day, month and year is displayed. A similar thing happens if the range of tick marks is bigger than one year, in that case only the corresponding year is shown. The following pictures show the before and after this change.
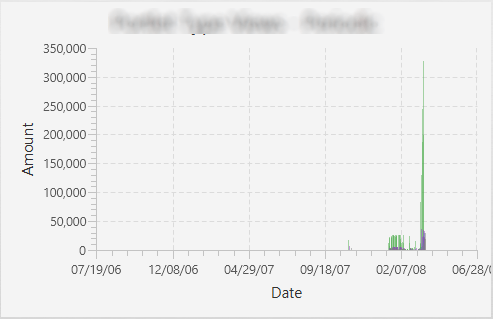
XYBarChart with a DateAxis – before change

XYBarChart with a DateAxis – after change
This is just a small detail that makes for an easier scanning of the chart by the user.
If you want to join me, in adding more features to the charts API, you are welcome. My eventual objective would be for this to be integrated in the JavaFX API (at least the DateAxis) although I don’t know if that would be possible.